What is a Continuous Random Variable?
A continuous random variable is one which takes values across an entire interval (or, in rare cases, a number of intervals).
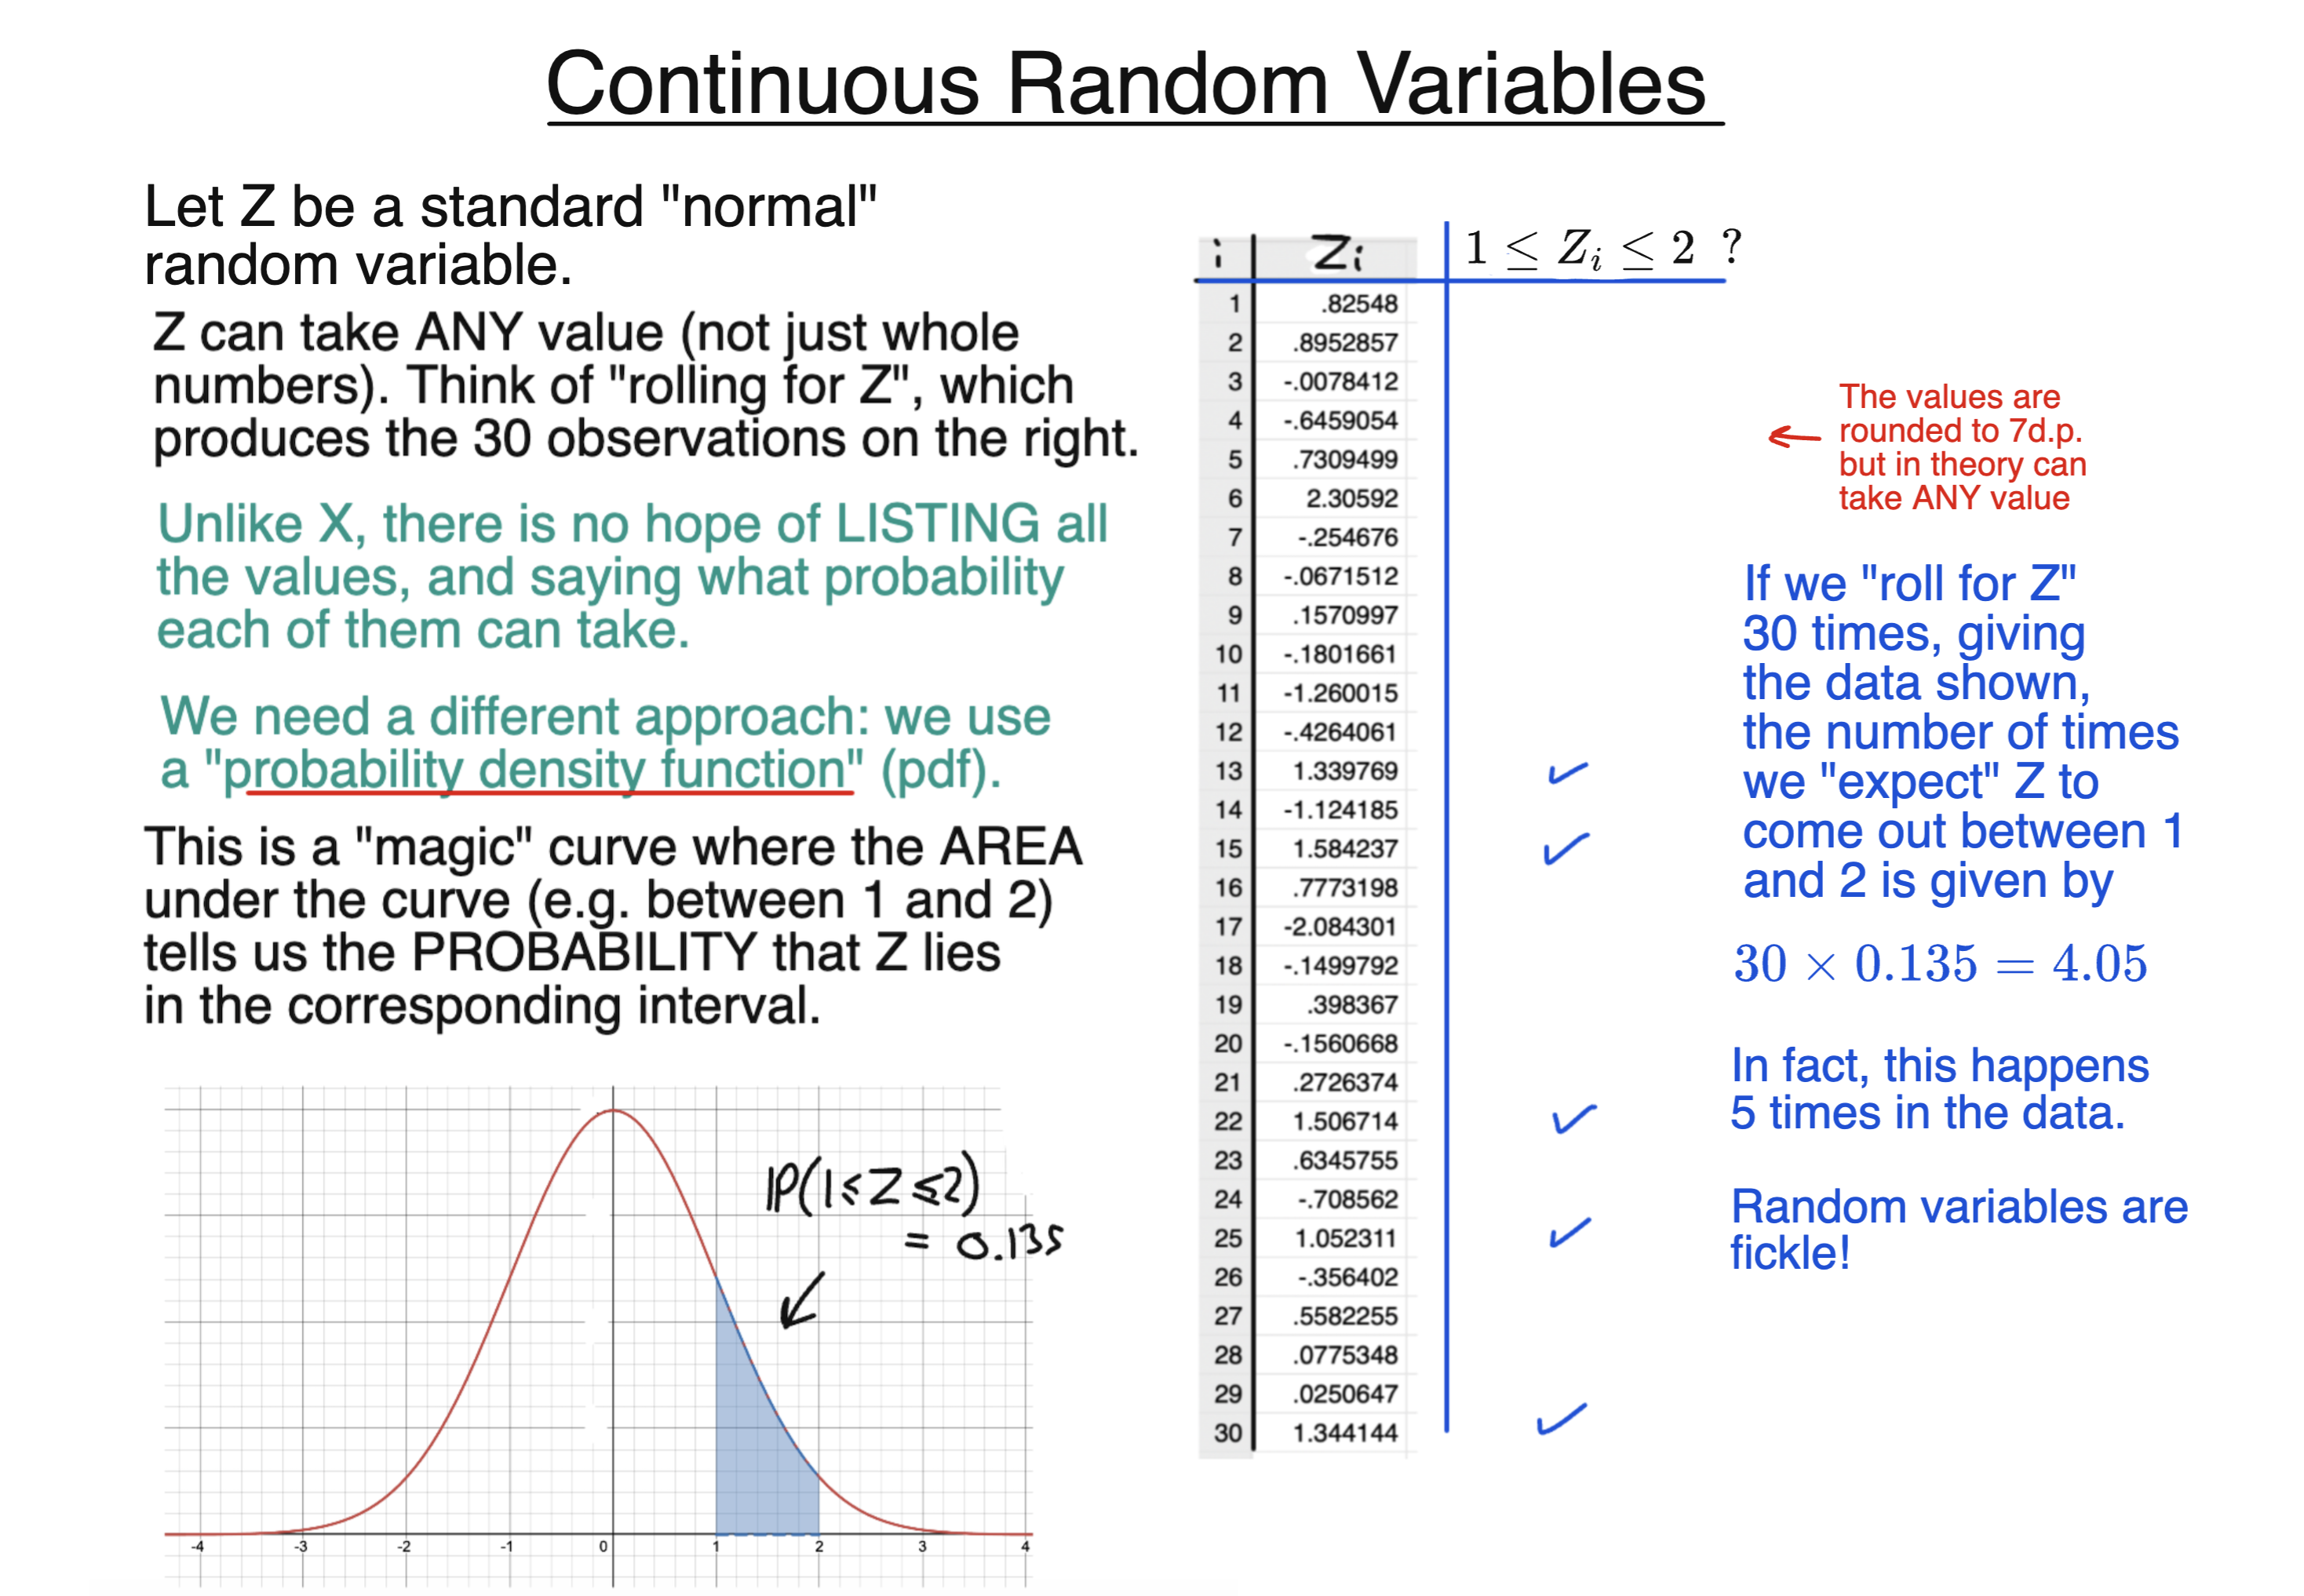
If $X$ is continuous, we do not generally talk about the probability that $X=x$, and indeed there are so many values $X$ can take that this will always be 0.
Rather, we talk only about the probability that it lies in a certain range.
Continuous random variables always have a “probability density function” (PDF). To find the probability that a continuous random variable lies in a range, we find the area UNDER the PDF within that range.
We write the PDF of $X$ as $f_X$.
Since we find areas under a function by integrating, such probabilities may be found as follows:
$$\mathbb{P}(a \le X \le b) = \int_{a}^{b} f_X(x)dx \ \ , \ \ a \le b$$